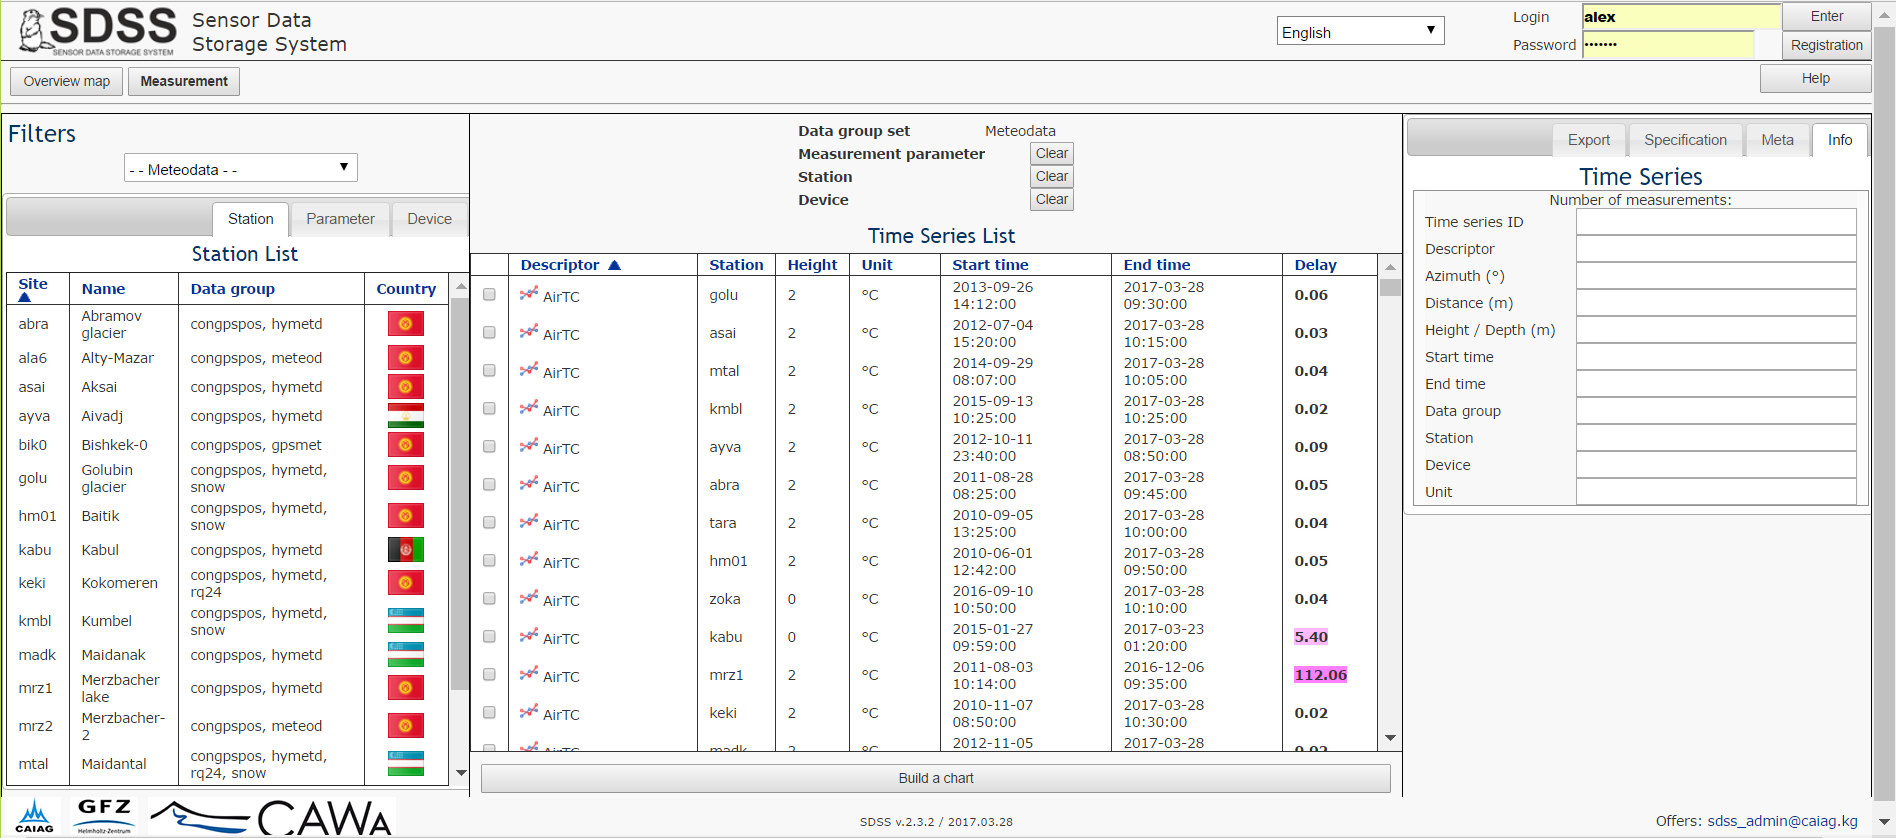
Page Measurements is intended for selecting time series from a list and working with them (information display, editing, charting, data export). The page consists of 3 panels.
The left panel Filters has a drop-down list Data Group Set at the top and three tabs below it. The drop-down list allows you to select the desired set and thereby reduce the number of stations, measurement parameters and sensor devices displayed in the tabs of the left panel as well as the number of time series in the middle panel. Tabs Station, Measurement parameter and Device are used to select, respectively, the station, measurement parameter and device and thereby to simplify a search of time series by reducing their number in the table of the middle panel.
The middle panel with Time series list contains 4 lines in the top part corresponding to the selected filter values. On right of each line is the button Clear, which allows you to cancel the filter results separately for each option.
The table below is a list of time series. There are two ways to select a row in a table, each of which is used for different purposes. The first way is to click anywhere in necessary row so that it changes its color to gray. This allows you to transfer data to the right panel of the page to display information about the selected time series, its export to a file and other operations. For the second method, tick the small square (checkbox) of the required row in the left column of the table. Clicking then the button Build a chart under the table, you can plot the selected time series in a separate window. It is possible simultaneously to build several graphs in one window by marking few checkboxes, but it is on the condition that all selected time series have the same units. If the unit of the subsequent row differs from the previous ones, the measurement unit of the previously marked rows is lost.
|
!!! |
It is necessary to remember that plotting of a large number of time series in one window significantly slows down the work. |
You can also plot a single time series by clicking
on the icon ![]() on the left of the column Descriptor of the
table Time series list.
on the left of the column Descriptor of the
table Time series list.
The table Time series
lists contains the following columns:
|
Column |
Explanation |
| Untitled | - The checkboxes mark the time series to plot them with
the button "Build a graph" under the table |
| Descriptor | - Keyword identifying a data type in the input file. The icon before the descriptor output the single time serial to a plot |
| Station | - Station short name |
| Height | - Device height above ground surface in meters. Negative values mean the depth |
| Unit | - Measurement unit of time series values |
| Start time | - First measurement time in the time series |
| End time | - Last measurement time in the time series |
| Delay | - Differnce between times of table displaying and last measurement in days |
Right panel of Page Measurements has 4 tabs:
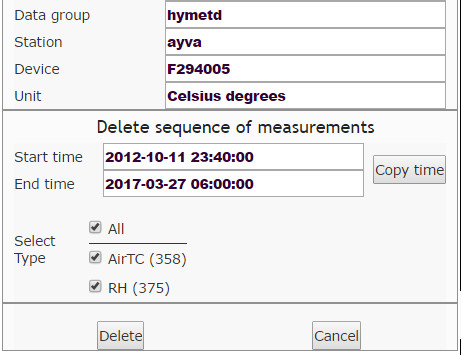
Tab Info displays information about the selected time series. Users of the category Editor can perform here the deletion of full time series/block of time series or its part, specifying the necessary time range, or edit the time series or its part, multiplying or adding its values with a given magnitude. The button Copy time is used to transfer the start and end times of the selected time series to the time fields for its deleting / editing. At one time, you can perform an operation of deleting / editing with several rows of one time series block, marking their by checkboxes.
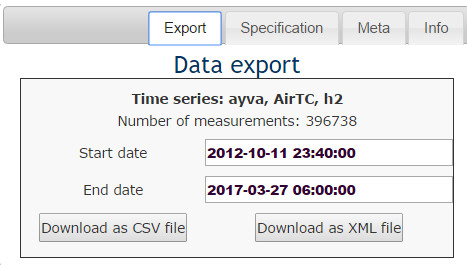
Export tab is used to output the time series data to XML or CSV file. At a time, you can export no more than 500,000 values of the time series. If you need more to download, perform this operation several times, specifying the required start and end times.
Tab Meta displays metainformation for the selected time series.